Debugging
The OpenAPI offers almost no information when an error occurs. Error information has to actively be sought by the programmer.
There are many tools available to debug OpenAPI applications. The right tool can quickly identify a problem. Familiarity with the full range will make it easier to choose the right one.
Tip
The very first step in an OpenAPI project should be implementing error detection and handling. It may be tempting to defer it but having good error handling will make development incomparably faster.
OpenAPI Errors versus DBMS Errors
There are two kinds of potential error: errors in the use of the OpenAPI, and errors in the use of the DBMS server. They are reported seperately. Furthermore synchronous and asynchronous functions return status information differently (regardless of which Pyngres package is being used).
OpenAPI control blocks for synchronous functions (i.e. those that complete before returning) have a xx_status member:
py.IIapi_initialize(inp)
if inp.in_status != py.IIAPI_ST_SUCCESS:
    print('check what happened')
The control block for
asynchronous functions (i.e. those that return before completing the
requested operation)
contain a nested IIAPI_GENPARM structure.
The status is returned in the gp_status member of
the xx_genParm structure.
py.IIapi_connect(cop)
if cop.co_genParm.gp_status != py.IIAPI_ST_SUCCESS:
    print('check what happened')
Note
An error in the use of the DBMS is not an OpenAPI error. A
call to IIapi_query() with a SELECT statement
that refers to a non-existent column will return with
gp_status of IIAPI_ST_SUCCESS because the SQL
was successfully transmitted. The SQL error will be reported later,
when IIapi_getQueryInfo() is called. It will return with
gp_status of IIAPI_ST_ERROR and its
gp_errorHandle will be set. The error handle can be used
to retrieve one or more error messages from the DBMS.
Error Checking and Handling
When an OpenAPI function returns a gp_status of
IIAPI_ST_ERROR or IIAPI_ST_FAILURE, and a
gp_errorHandle value, the detailed error message(s) can be retrieved
using IIapi_getErrorInfo(). See Fetching Error Information for
an example.
Tracing Applications With Loguru
The Loguru package is a good tool to obtain debugging information. Controlling the level of detail is simple, and it can be turned off and on at will. Logging actions can remain embedded in an application after deployment, ready to diagnose live issues.
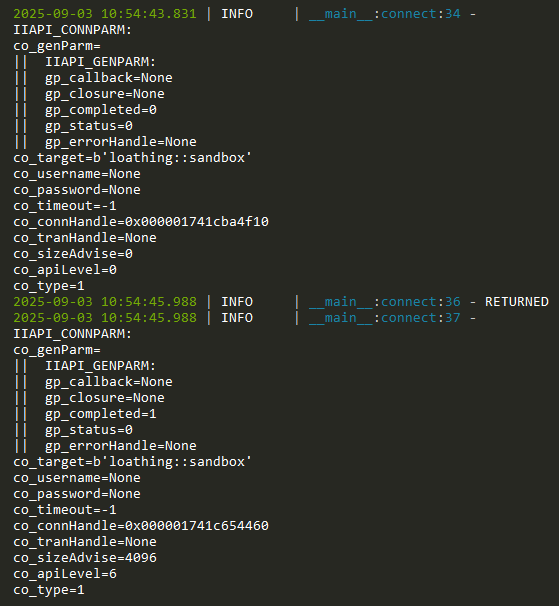
The output to the console (stdio) includes a timestamp, the record type, the source code location where the record originated, and a message.

Typical logoru output
It can be used just to trace the flow of control through an application, or it can be used understand deeply embedded errors. The following example shows it being used to dump an OpenAPI control block before and after an OpenAPI function call:
Import the logger:
from loguru import logger
Invoke it to dump the control block before and
after calling IIapi_connect():
logger.info(cop)
await py.IIapi_connect(cop)
logger.info('RETURNED')
logger.info(cop)
Readable control block presentation using loguru
The log trace shows the call was completed and successful,
and that it returned values such as co_connHandle and
co_sizeAdvise.
The volume and detail of the logging messages is controlled by
the LOGURU_LEVEL environment variable. It is set to ‘INFO’
by default. Setting it
to SUCCESS will provide a less detailed “broad brush” indication
of what is occuring
in the OpenAPI. Setting it to DEBUG will give considerable detail.
Setting it to TRACE can be overwhelming unless logging
is confined to small
areas of the application.
Tip
Loguru is highly versatile. Read the Loguru documentation.
Tracing Pyngres With Loguru
pyngres uses loguru
internally, but it is turned off by
default to avoid interfering with whatever logging the application may do.
If the application has imported loguru it can turn internal pyngres
logging on:
logger.enable('pyngres')
It can also turn it off again, so that logging can be confined to selected regions of source code or depending on conditions in the running application:
logger.disable('pyngres')
Enabling Development Mode
pyngres provides optional checking and tracing that is useful
during development and debugging. The additional services are enabled
by environment variables.
Running an application with IIAPI_DEV_MODE set to ON:
displays version information when Pyngres is imported
displays the full path of the OpenAPI library that was discovered
enables
logurutracing of OpenAPI function callsraises an exception when the application attempts to assign a value to a non-existent control block member
Tip
The use of IIAPI_DEV_MODE during development is strongly recommended.
Python allows members to be added to control blocks dynamically, so it is not a Python error to assign a value to a non-existent control block member by mis-keying the intended name. Such errors are hard to locate without using IIAPI_DEV_MODE.
Tip
The volume of loguru messages can be controlled
using the LOGURU_LEVEL environment variable.
Running an application with IIAPI_DEBUG_ONERROR set to ON:
starts the Python debugger at the point where a
Pyngresfunction returns a status other than IIAPI_ST_SUCCESS
Warning
IIAPI_DEBUG_ONERROR degrades the performance of pyngres.asyncio.
Because the OpenAPI function status is not available until the function
has completed, setting IIAPI_DEBUG_ONERROR forces
all functions to be synchronous. That prevents them from promptly
yielding to the
the event loop which makes the responsiveness of
of the application erratic.
Enabling OpenAPI and GCA Tracing
The OpenAPI is layered on top of the General Communication Architecture (GCA). GCA is the protocol used by the DBMS and client applications to exchange data, queries, and commands.
To start OpenAPI tracing on Widows:
set II_API_LOG=c:\temp\api.log
set II_API_TRACE=5
On Linux/MacOS:
export II_API_LOG=/tmp/api.log
export II_API_TRACE=5
Use the
II_API_TRACE environment variable to indicate the level of
OpenAPI trace detail required (1 = least detail, 5 = most detail).
To also include GCA tracing in the OpenAPI trace log, on Widows:
set II_GCA_TRACE=6
On Linux/MacOS:
export II_GCA_TRACE=6
set the
II_GCA_TRACE environment variable to indicate the level of
GCA trace detail required (1 = least detai, 6 = most detail).
Do not set II_GCA_LOG.
OpenAPI and GCA tracing can reveal otherwise elusive errors in the way the OpenAPI is being used. It can show when an OpenAPI call:
has been made when the protocol is not in a state where the call is permissible
sent the server the wrong number of arguments
was given an incorrect handle to use
was used to send invalid data to the DBMS.
Invoking the Python Debugger
A pyngres application can be run in the pdb debugger just like
any Python script.
Tip
Instead of running the application in pdb, a convenient trick is
to call breakpoint() in the source code. Even if the
appplication was run in the usual way it will start the debugger at
that point.
If the API_DEBUG_ONERROR environment is set before running a
pyngres application, the occurence of an OpenAPI error will
automatically start the Python debugger at the point the error was detected.
Understanding Locking, Logging, I/O, and Query Plans
Building high-performance multi-user enterprise applications depends on being able to identify hot-spots and resource contention, during development.
pyngres supports lock tracing, transaction log tracing, I/O tracing,
and query execution plan (QEP) tracing. The various types of tracing are
enabled using the SQL commands:
SET LOCK_TRACE
SET LOG_TRACE
SET IO_TRACE
SET QEP (see also SET OPTIMIZEONLY)
The DBMS sends the trace information to the OpenAPI as the application executes.
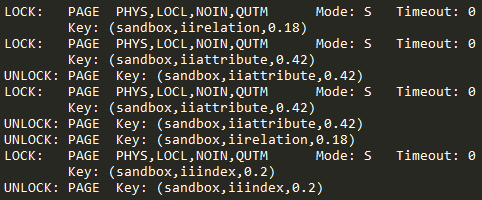
Typical lock-trace messages
Because the trace records arrive outside the normal sequence of messages from the DBMS they must be captured using callbacks. (See Setting Up Tracing to get started.)
Server-Side Session Logging
To be confident that the expected SQL statements and data are being exchanged between the Python client and the Actian DBMS, turn on session or server tracing in the DBMS.
Refer to SET SERVER_TRACE or SET SESSION_TRACE in the SQL Reference Guide.
Note
Server-side tracing would not normally be activated by the Python application. Privileged access to the DBMS host machine is usually required.
The DBMS user ID that issues the SET SERVER_TRACE or SET SESSION_TRACE statement must have the set trace points privilege or be a security administrator.
The session logs are written to files on the DBMS host machine. It must be possible to get access to them.
Coordinated assistance from the Actian DBMS system administrator may have to be sought.